I am working on a new project which unlike my previous projects completely relies on AWS “serverless” infrastructure. Of course, there are servers behind the infrastructure but for me, as a developer, the infrastructure is just a set of APIs. Shameless plug: check it out, it’s like AWS for web comments and a Disqus killer at the same time :-)
The project follows pretty standard architecture for AWS:
API Gateway -> Lambda -> DynamoDB
Among these technologies only DynamoDB is not scalable automatically by default. For those, who are not familiar with DynamoDB: it allows defining read and write capacity for every table or database index, where:
- One read capacity unit = one strongly consistent read per second, or two eventually consistent reads per second, for items up to 4 KB in size.
- One write capacity unit = one write per second, for items up to 1 KB in size.
So whenever your application produces more data or queries, your requests to DynamoDB will be throttled.
Until the summer of 2017 you had to adjust the capacity settings manually or rely on external solutions which would scale up and scale down your database. Today automatic scalability is the part of DynamoDB.
So I wanted to test how this works and document the process and findings. The first thing that took me a while to figure out was how to configure the feature via CloudFormation since I have been using it for the rest of infrastructure already. At the end of the day, it is not that complex.
First, a scaling role is required:
ScalingRole:
  Type: "AWS::IAM::Role"
  Properties:
    AssumeRolePolicyDocument:
      Version: "2012-10-17"
      Statement:
        -
          Effect: "Allow"
          Principal:
            Service:
              - application-autoscaling.amazonaws.com
          Action:
            - "sts:AssumeRole"
    Path: "/"
    Policies:
      -
        PolicyName: "root"
        PolicyDocument:
          Version: "2012-10-17"
          Statement:
            -
              Effect: "Allow"
              Action:
                - "dynamodb:DescribeTable"
                - "dynamodb:UpdateTable"
                - "cloudwatch:PutMetricAlarm"
                - "cloudwatch:DescribeAlarms"
                - "cloudwatch:GetMetricStatistics"
                - "cloudwatch:SetAlarmState"
                - "cloudwatch:DeleteAlarms"
              Resource: "*"
Second, you need to create a resource to describe what you want to scale. For DynamoDB, it is a table or an index:
ReadCapacityScalableTarget:
  Type: "AWS::ApplicationAutoScaling::ScalableTarget"
  Properties:
    MaxCapacity: 20
    MinCapacity: 5
    ResourceId: table/comments
    RoleARN:
      Fn::GetAtt: [ ScalingRole, Arn ]
    ScalableDimension: dynamodb:table:ReadCapacityUnits
    ServiceNamespace: dynamodb
In the target you define constraints like minimum and maximum capacity and the type of the units (i.e. read or write capacity) that you want to scale.
And the last step is to define the policy for scaling up and down:
ReadScalingPolicy:
  Type: "AWS::ApplicationAutoScaling::ScalingPolicy"
  Properties:
    PolicyName: ReadAutoScalingPolicy
    PolicyType: TargetTrackingScaling
    ScalingTargetId:
      Ref: CommentsReadCapacityScalableTarget
    TargetTrackingScalingPolicyConfiguration:
      TargetValue: 80.0
      ScaleInCooldown: 60
      ScaleOutCooldown: 60
      PredefinedMetricSpecification:
        PredefinedMetricType: DynamoDBReadCapacityUtilization
In this snippet the metric DynamoDBReadCapacityUtilization is connected to the scalable target and altogether it means that if the utilization is more than 80%, DynamoDB will scale out and if it is less than 80% it will try to scale in. While scaling out and scaling in DynamoDB will wait 60 seconds before performing subsequent scale ups or scale downs.
Basically, I wanted to test and see how this works. I decided to test the complete app and not only the DynamoDB because I was eager to see how the app behaves during the scaling. My initial plan was to use Apache ab tool to produce some load which should trigger a scale-up. But I ended up doing it differently.
Finding #1. Tools like ab have problems accessing API gateway endpoints due to SSL handshake error. It turns out that API gateway requires SNI which is not supported by ab and a bunch of other tools. More details here
Since I didn’t need statistics about the app performance and just wanted to experience auto-scaling of DynamoDB, I wrote a simple bash script which uses curl to send requests:
#!/bin/bash

for i in {1..1000}; do
  for concurrency in {1..4}; do
    curl TARGET_URL --compressed -s -o /dev/null -w "%{http_code}" &
  done
  echo " Done $i"
  sleep 1
done
With this script running, I started to monitor DynamoDB. For a couple of minutes nothing has been happening and my endpoint started to return errors. After 1 or 2 minutes I saw a message in the DynamoDB UI that my read capacity will be increased from 1 to 6.
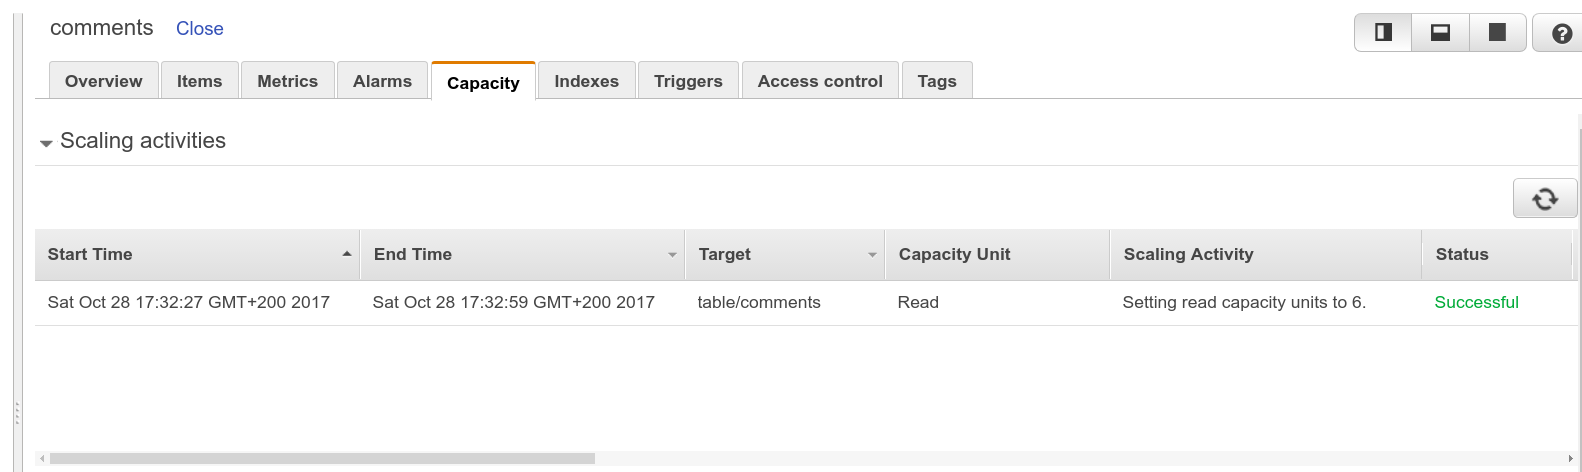
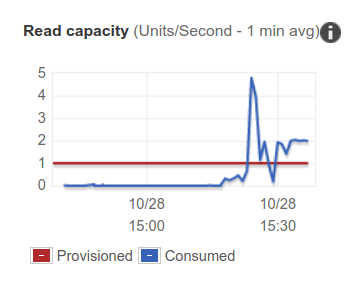
Finding #2. The charts in CloudWatch Logs and DynamoDB are not realtime (no even near-realtime). After the read capacity has been increased I could not see this on the charts for a while.
While seeing that the read capacity has been increased, I was still seeing many errors from my endpoint. I went to the lambda UI and saw that many of invocations were timing out because of the 5 sec timeout which my lambda functions had.
Finding #3. AWS SDK for Node will re-try requests for DynamoDB up to 10 times using exponential back-off strategy. So for my case it means that the Lambda function times out and the client does not get an error message regarding throttling. Also it means that within those 5 seconds while lambdas are running, the DynamoDB client probably generates even more requests to DynamoDB instead of failing early. I still don’t have an answer why the errors persisted for quite a while after scaling up. Perhaps it is due to re-tries or perhaps the scale-up takes a bit more time on the lower level than it is shown in the UI.
So for my use case I decided to disable retries:
const service = new AWS.DynamoDB({ maxRetries: 0 });
const db = new AWS.DynamoDB.DocumentClient({
  apiVersion: '2012-08-10',
  service,
});
Once I stopped my script I saw a successful scale down back to the original capacity.
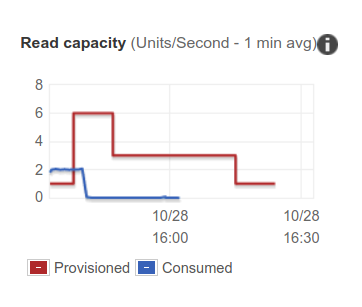
Finding #4. Since it takes several minutes to scale up, DynamoDB tries to fulfill requests using so called burst capacity. This explains why you may not be seeing failures immediately after you put the system under the exceeding load.
My take aways from this tests are
- it’s better to plan capacity ahead instead of relying on auto scaling all the time
- have some backup capacity allocated so that automatic scale-ups are not required under normal workloads
- short bursts of load will not be handled by auto scaling unless there is some burst capacity available
- exponential back-off strategy is not working well for apps running on AWS Lambda unless you are willing to put huge timeouts and pay for Lambda time during the retries. Whenever possible it is better to delegate the responsibility for retries to the end client.